Post-mortem: 1h30 downtime on a Saturday morning
Postmortem Culture: Learning from Failure
At my work, we constantly grow and add new services while managing all the previous stacks built over the years. One big step 2 years ago was to shift our infra from docker-compose files on Debian VMs to Kubernetes workloads.
As it improved our ability to scale and easily deploy new services, we learned a lot through mistakes… Especially myself for everything related to infrastructure! Challenging my main goal: Providing high availability & reliability for our SaaS.
This last Saturday, I received an alert on my slack mobile app… 3 APIs were unreachable by black box monitoring. On a week-end, having downtime is not really a big deal as our people and clients are using our tools almost exclusively during the week. But still, I had to jump on it and find out what could have happened.
Without even checking what went wrong, the APIs were all sharing the same Kubernetes cluster, and I know our main Single Point of Failure: our reverse-proxy Traefik (“Ingress-Controller” in a more kubernetes jargon).
My first move was to check our tools directly, and notice the APIs were not reachable.
2nd step, I double-checked the logs of the impacted APIs, and made sure I could connect with a kubectl port-forwardto the Services. Then, it was time to dive on our beloved reverse-proxy Traefik logs as a first glance at the APIs pods didn’t show any problem.
too many certificates (5) already issued for this exact set of domains in the last 168 hours. Here it was, and I’ll come back to the root cause a bit later. My priority was to put the APIs back on track and reachable from the outside. As the number of unreachable services was quite low, I decided to change the subdomain of our cluster entry point to something else, and update all the relative configurations.
In the last 6 months, we adopted GitOps for all our Kubernetes infrastructure, so it was pretty easy to compare the current Traefik deployment to the other Traefik deployments for other clusters. This faulty Traefik had several “misconfigurations” as it was behind with the helm chart version, the Traefik version, and some other redirections from HTTP to HTTPS. I basically just copy-pasted a recent Traefik configuration to our old Traefik, changed the wildcard URL, did a first commit to remove the faulty Traefik (yes at this point, since everything getting served by Traefik was not reachable, I leveraged the opportunity to upgrade Traefik at the same time), and then pushed the new configuration.
Afterwards, I connected to our cloud provider and added 2 new A records to the cluster load balancer to match the new URL and the new URL wildcard.
Next step was to update some configurations in different repositories in 3 steps: VSCode open - Search & replace the old URL - git commit & push.
And boom, problem solved in 15 min max! … It doesn’t really match the title, does it?
I logged into my SaaS account, refreshed the page… the service was still hanging. Wtf?
I made sure the new pod of one the app with the new URL configuration was deployed, but the pod was pending. The cluster reached its capacity, therefore a new node was getting spawned and the cluster auto-scaling can take up to 5 minutes. Few minutes later, I refreshed the page yet another time and… service still hanging. 💢
I started to double-check all my commits and the logs of each pods (Traefik, and the 3 APIs). Nothing.
Could it be the SSL certificates? I “ssh-ed” into the Traefik pod, and went to data/acme.json to notice some old certificates were still present. Honnestly at this point, having old leftovers certficates was not related to the failure and I know it, but I wanted to have a clear configuration and eliminate possible failure points. So I decided to delete Traefik, remove the PVC with the acme.json certificates and redeploy Traefik. Now, I got fresh certificates and thought maybe it should work? (Yeah, you never know)
I refreshed the page… still hanging 😢
So I took a deep breath and went into detail through the problem:
- Inspect the console network tab
- check the load balancer is online and reachable
- check the A domains are pointing to the load balancer (LB) and…
At this moment, I knew what went wrong. The A domain records were pointing to the wrong LB IP. It became clear and I realized that when I deleted my Traefik deployment, it destroyed the current cluster load balancer.
30 seconds later, the records were updated with the new LB’s IP. I refreshed the page… still hanging. But then, I am pretty sure I have my finger on the problem. So I reached to my phone, and from the browser, I could access the page!
The load-balancer TTL is 1h, that’s why I couldn’t get the new IP on my laptop.
My last check was to make sure the 3 services were accessible, so I added some blackbox monitoring for the new URLs. With Synthetic monitoring from Grafana, I can create HTTP probes to ping my services’ health endpoints.
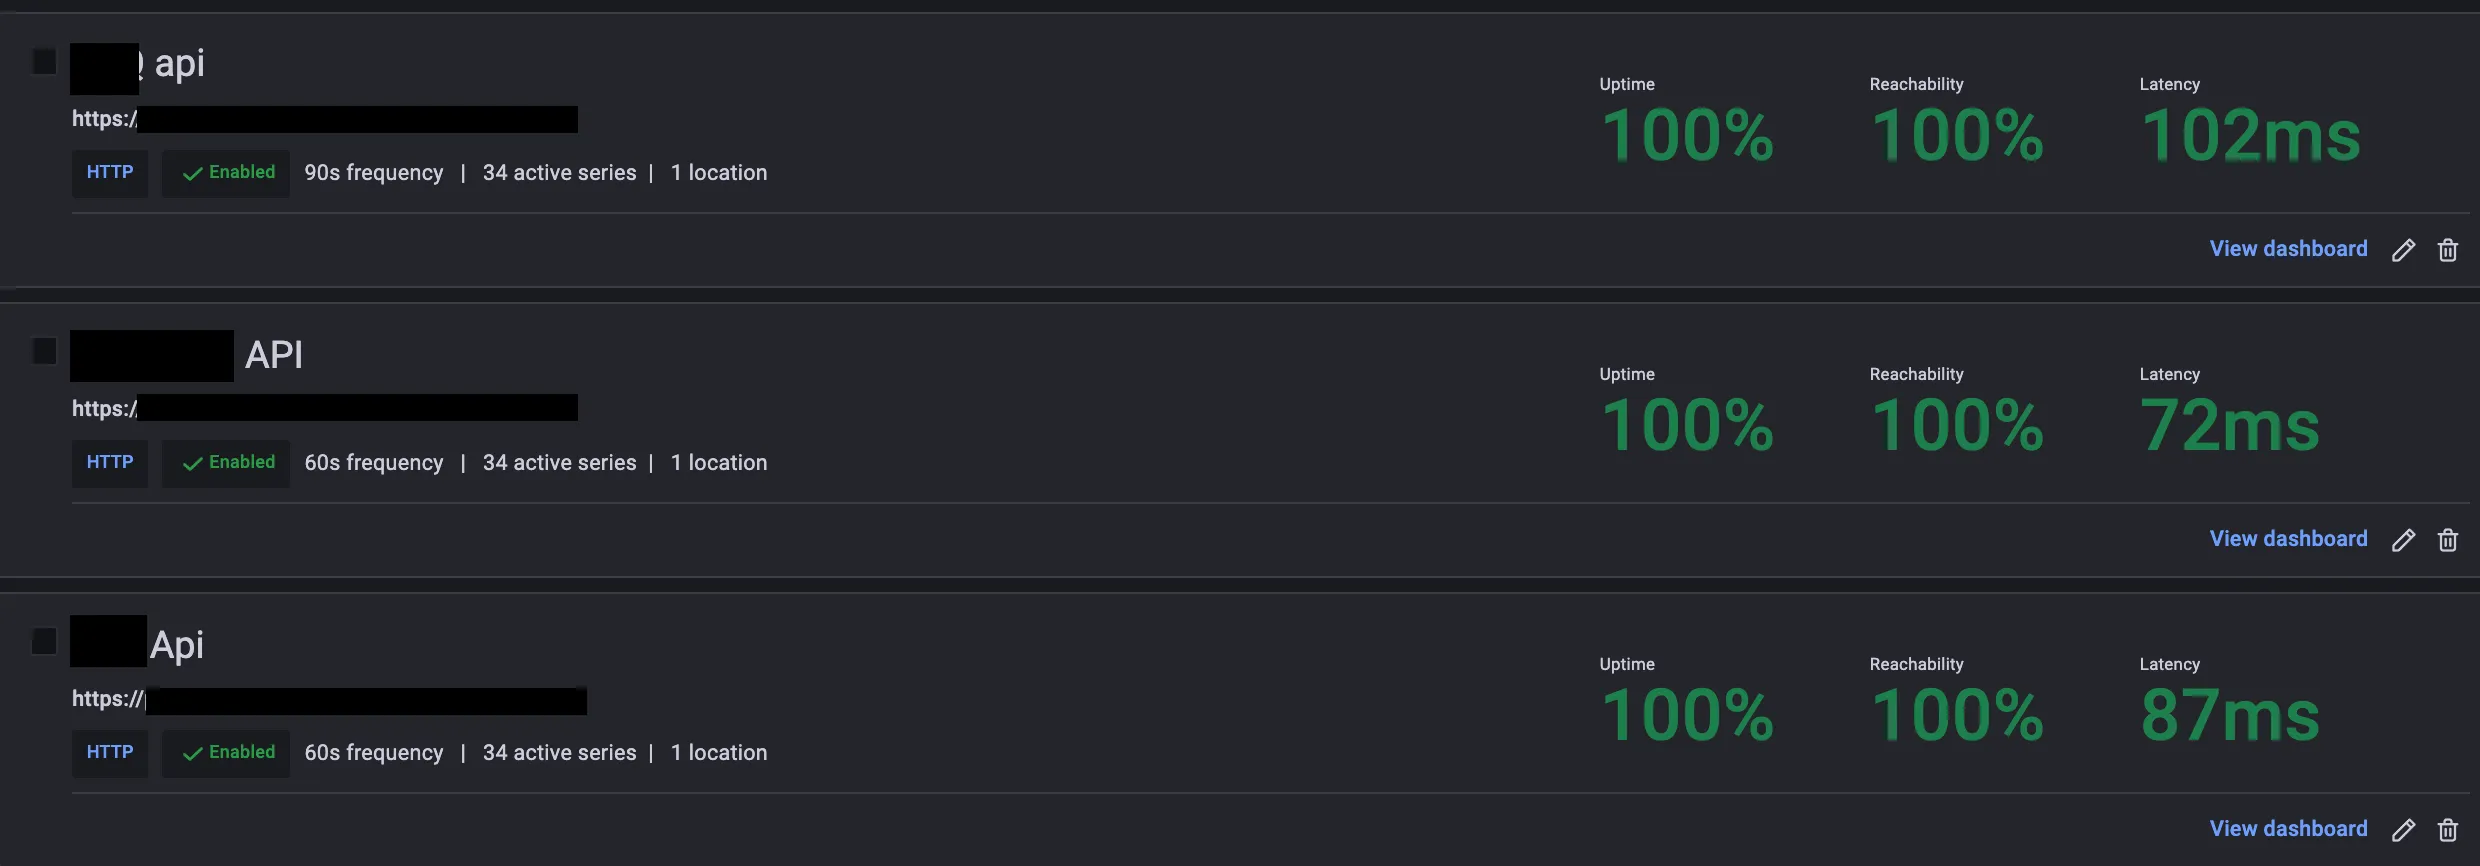
Phew, everything went back to normal. In total it took a bit less than 1h30, but thankfully it was on a Saturday.
Learnings:#
- Don’t mix fixing and maintenance. I leveraged the fact that we had an almost non-existing trafic on Saturday to upgrade our Traefik. If I hadn’t deleted it and recreated a new one, the load-balancer wouldn’t have been recreated, and the problem would have taken a maximum of 15 min to be fixed. Good learning on this one!
- Having a peer-review on infrastructure changes. I could have requested a review from one of the dev in the team, and with a rubber duck effect, I would have noticed the problem.
Remediation#
The problem is fixed, now it is time to find the root cause!
too many certificates (5) already issued for this exact set of domains
in the last 168 hoursIs the Traefik instance missing persistence of the certificates and regenerating new ones on every restart?
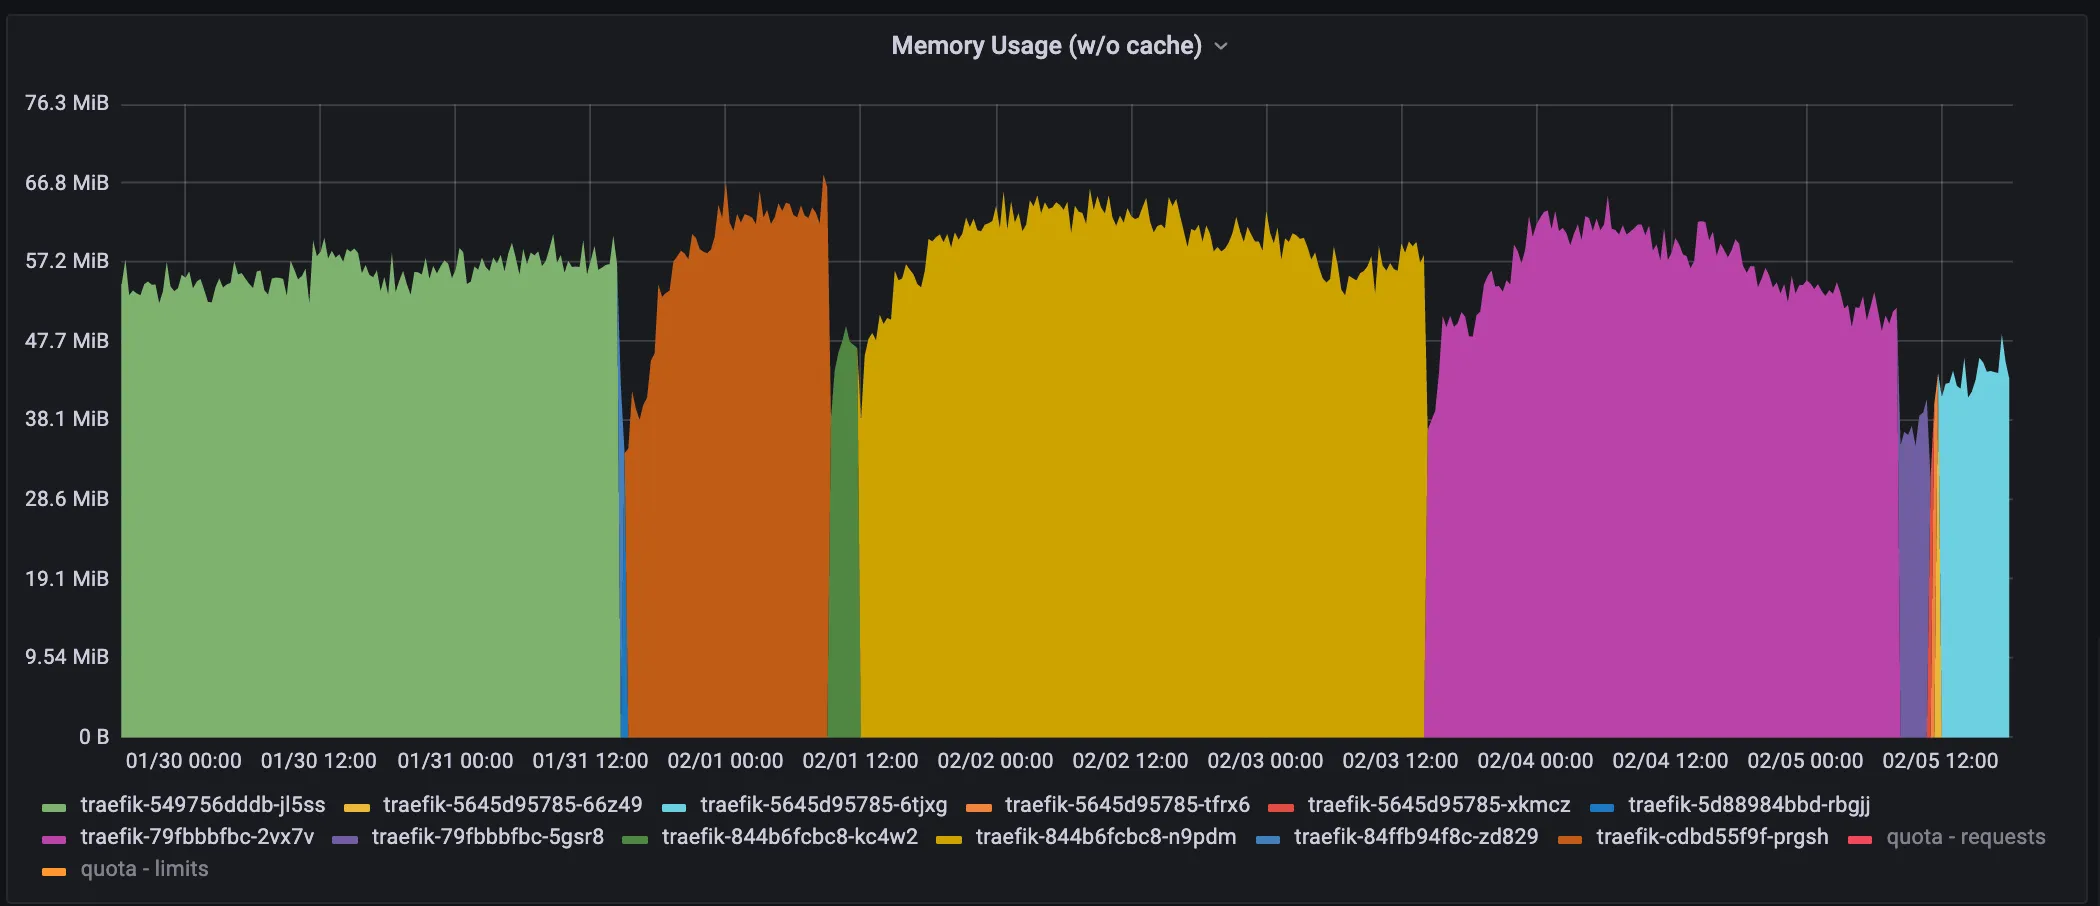
The image above shows the memory usage of different Traefik pods over the last 7 days. As the auto-scaler is quite active, I am not surprised the pods get recreated on different nodes.
In total, we had 10 different pods before I started to work on a solution.
The Let’s Encrypt limit is the following: 50 certificates per domain per 7 days
If the pod restarts 5 times, it could reach the 50 certificates limit… I check the logs, but I only see 10 “start-up messages” over the last 7 days.
Could it be the limit is different? I check an online service: https://letsdebug.net/ with my wildcard challenge: DNS_01.
The Duplicate Certificate limit (5 certificates with the exact same set of domains
per week) has been exceeded and is affecting the domain
Indeed the limit is only 5 if the certificate request is a duplicate.
More on it on the Let’s encrypt documentation: https://letsencrypt.org/docs/rate-limits/
A certificate is considered a renewal (or a duplicate) of an earlier certificate if it contains the exact same set of hostnames, ignoring capitalization and ordering of hostnames. For instance, if you requested a certificate for the names [
www.example.com,example.com], you could request four more certificates for [www.example.com,example.com] during the week. If you changed the set of hostnames by adding [blog.example.com], you would be able to request additional certificates.
Hum, time to check why the certificate was re-requested. So I start to dive inside different blog posts & documentations about Let’s encrypt, Traefik and Kubernetes. But one thing is ticking and doesn’t feel right, I am pretty sure my certificates were never saved and got re-requested at each pod restart. I came back to my Kubernetes infrastructure repository and double-checked the old Traefik configuration and the following YAML part was not present on the other Traefik deployments:
# traefik helm chart values
...
     volumes:
       - mountPath: /data
         name: traefik-config
         type: configMap
...
I search the Helm chart official values to read the comments and I find this: https://github.com/traefik/traefik-helm-chart/blob/master/traefik/values.yaml#L141
# Add volumes to the traefik pod. The volume name will be passed to tpl.
# This can be used to mount a cert pair or a configmap that holds a config.toml file.
volumes: []
# - name: public-cert
#   mountPath: "/certs"
#   type: secret
# - name: '{{ printf "%s-configs" .Release.Name }}'
#   mountPath: "/config"
#   type: configMap
So every time a pod restarted, the /data folder was erased… and with it my acme.json file containing the certificates!
Tricky! I hadn’t payed attention to some YAML parts from the time I have set up the cluster. I reviewed our other clusters but thankfully, they were fine and had the correct configuration.
The persistence was already enabled with the following code. But a bad usage of the volumes lead to the failure…
# https://github.com/traefik/traefik-helm-chart/blob/master/traefik/values.yaml#L397

persistence:
  enabled: false
  name: data
#  existingClaim: ""
  accessMode: ReadWriteOnce
  size: 128Mi
  # storageClass: ""
path: /dataConclusion#
The fact we work with micro-services didn’t lead to a global down time, only 3 micro-services were out, resulting in only 3 features of our SaaS being down.
Committing the infrastructure code definitely saved a lot of time in this investigation! And to prevent future certificates rate-limiting problems, I should probably look into monitoring the rate limit of our domains… But that’s a topic for next week!
TL;DR:#
Yet another Helm chart misconfiguration, 2 settings were conflicting with each other. The cluster where all started was originally a cluster to test new charts/deployments and it eventually became a production environment. “If it works, don’t touch it”, as the Traefik configuration was working fine I never thought about double-checking every values.